drawCell::drawCellShiny()R Does Everything!
R
Visuals
2022
Introduction
One of the reasons that I prefer R over other languages is there is a solution for everything because R has 18960 packages (as of 12/22/2022) for statistics, data analysis, machine learning, visualization and so very much more.
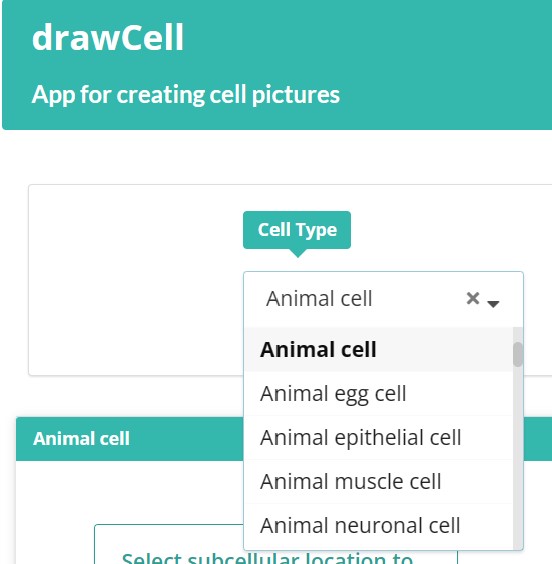
drawcell Package
Below is just one example. It is a new package that provides an interactive Shiny app to build a wide variety of cells. Calling the Shiny app is simple:
knitr::include_graphics("cell.jpg")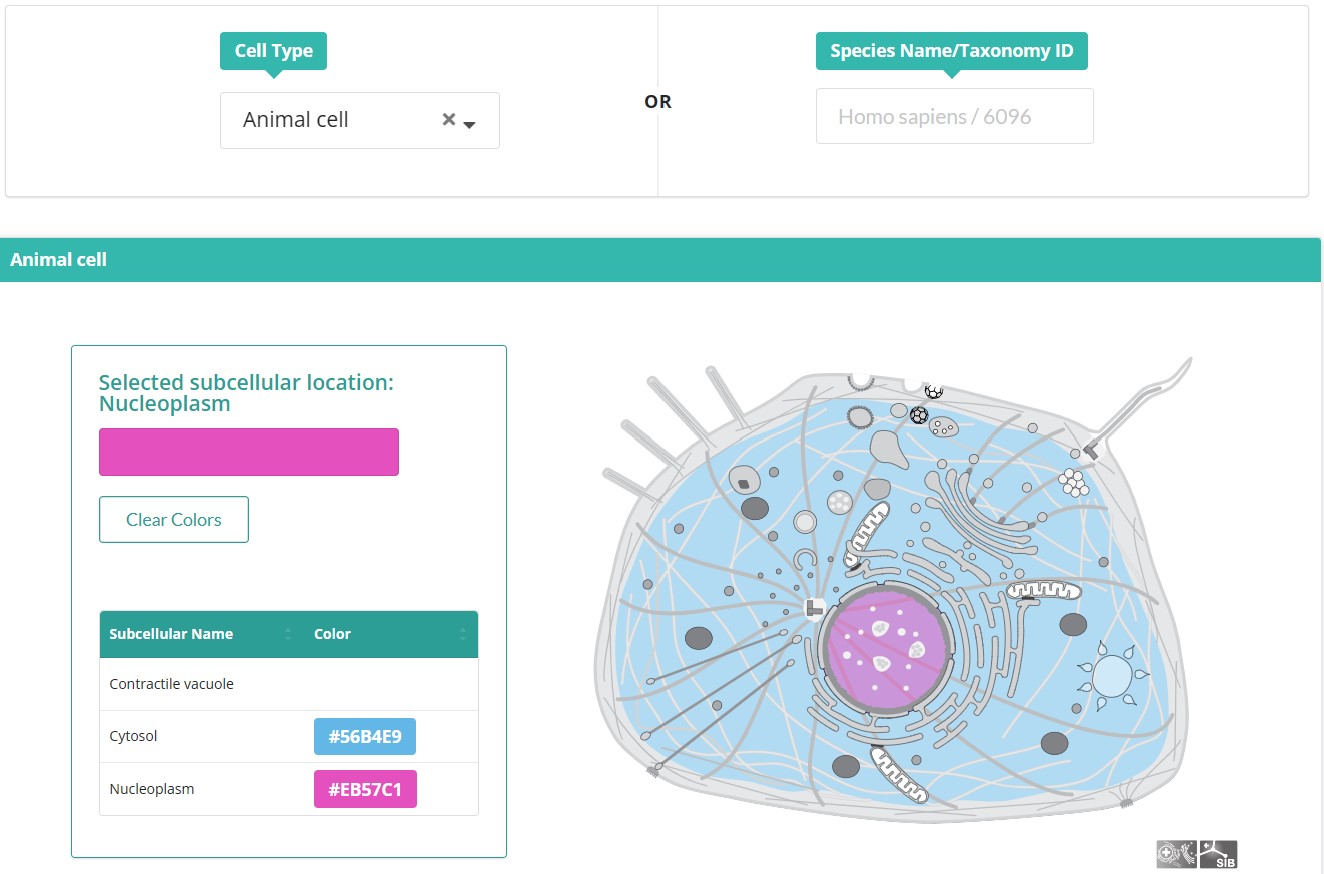
Once you select a cell, you can add colors to identify the different part of the cell. Lastly, you can copy the R Code to include it in a documents as I have done below.
The code to reproduce the selections from the Shiny app is shown below.
library(drawCell)

drawCell(6072, list( "SL0073" = "#1BFA14", "SL0091" = "#F01650", "SL0248" = "#57EBBC", "SL0235" = "#EDDC57", "SL0286" = "#F01650", "SL0039" = "#F0E113", "SL0135" = "#F21347", "SL0138" = "#F21347", "SL0190" = "#2EF513", "SL0101" = "#2EF513", "SL0066" = "#4C13F7", "SL0170" = "#14FAEB", "SL0204" = "#4214FA", "SL0180" = "#4214FA", "SL0023" = "#1BFA14"))
You can learn more about this package here and here.
What is the takeway from this brief document? Simple - R can do EVERYTHING!